Somerset County Council elections
None
None
Somerset County Council in England was elected every four years. Since the last boundary changes in 2001, 58 councillors were elected from 58 wards . In 2013 and 2017, 55 councillors were elected from 54 wards. In 2022, 110 councillors were elected and these transitioned over to Somerset Council , the unitary authority the replaced the county council on 1 April 2023.
Political control
Since 1974 political control of the council has been held by the following parties: [1]
| Party in control | Years | |
|---|---|---|
| Conservative | 1974–1985 | |
| No overall control | 1985–1989 | |
| Conservative | 1989–1993 | |
| Liberal Democrats | 1993–2001 | |
| No overall control | 2001–2005 | |
| Liberal Democrats | 2005–2009 | |
| Conservative | 2009–2022 | |
| Liberal Democrats | 2022–2023 |
Leadership
The leaders of the council since 2001 have been: [2]
| Councillor | Party | From | To | |
|---|---|---|---|---|
| Cathy Bakewell | Liberal Democrats | 2001 | 16 May 2007 | |
| Jill Shortland | Liberal Democrats | 16 May 2007 | 24 Jun 2009 | |
| Ken Maddock | Conservative | 24 Jun 2009 | 16 May 2012 | |
| John Osman | Conservative | 16 May 2012 | 7 May 2017 | |
| David Fothergill | Conservative | 24 May 2017 | 25 May 2022 | |
| Bill Revans | Liberal Democrats | 25 May 2022 | 31 March 2023 |
Council elections
- 1973 Somerset County Council election
- 1977 Somerset County Council election
- 1981 Somerset County Council election (boundary changes) [3]
- 1985 Somerset County Council election
- 1989 Somerset County Council election
- 1993 Somerset County Council election
- 1997 Somerset County Council election
- 2001 Somerset County Council election (boundary changes increased the number of seats by one) [4]
- 2005 Somerset County Council election
- 2009 Somerset County Council election
- 2013 Somerset County Council election
- 2017 Somerset County Council election
- 2022 Somerset County Council election
County result maps
-
 2001 results map
 -
 2005 results map
 -
 2009 results map
 -
 2013 results map
 -
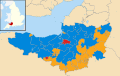
 2017 results map
 -
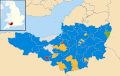
 2022 results map


By-election results
1997-2001
| Party | Candidate | Votes | % | ±% | |
|---|---|---|---|---|---|
| Conservative | 1,428 | 42.6 | +7.2 | ||
| Liberal Democrats | 1,125 | 33.6 | -1.4 | ||
| Labour | 798 | 23.8 | -5.8 | ||
| Majority | 303 | 9.0 | |||
| Turnout | 3,351 | 37.0 | |||
| Conservative hold | Swing | ||||
| Party | Candidate | Votes | % | ±% | |
|---|---|---|---|---|---|
| Conservative | 948 | 68.2 | +28.7 | ||
| Liberal Democrats | 442 | 31.8 | -14.0 | ||
| Majority | 506 | 36.4 | |||
| Turnout | 1,390 | 28.0 | |||
| Conservative gain from Liberal Democrats | Swing | ||||
2005-2009
| Party | Candidate | Votes | % | ±% | |
|---|---|---|---|---|---|
| Conservative | Matthew Ellis | 1,568 | 51.2 | +6.9 | |
| Liberal Democrats | Ian Hasell | 1,497 | 48.8 | +9.7 | |
| Majority | 71 | 2.4 | |||
| Turnout | 3,065 | 43.8 | |||
| Conservative hold | Swing | ||||
| Party | Candidate | Votes | % | ±% | |
|---|---|---|---|---|---|
| Conservative | Margaret Robinson | 950 | 47.4 | +10.0 | |
| Liberal Democrats | Rachel Witcombe | 783 | 39.1 | +5.5 | |
| Labour | Christopher Inchley | 271 | 13.5 | -15.5 | |
| Majority | 167 | 8.3 | |||
| Turnout | 2,004 | 29.0 | |||
| Conservative hold | Swing | ||||
2009–2013
| Party | Candidate | Votes | % | ±% | |
|---|---|---|---|---|---|
| Conservative | John Parham | 1,307 | 41.3 | ||
| Liberal Democrats | Garfield Kennedy | 892 | 28.2 | ||
| Labour | Chris Inchley | 711 | 22.5 | ||
| Green | Ian Forster | 256 | 8.1 | ||
| Majority | 415 | 13.1 | |||
| Turnout | |||||
| Conservative hold | Swing | ||||
| Party | Candidate | Votes | % | ±% | |
|---|---|---|---|---|---|
| Liberal Democrats | Paul Maxwell | 1,333 | 53.6 | ||
| Conservative | Paul Thompson | 943 | 37.9 | ||
| Green | Ian Greenfield | 108 | 4.3 | ||
| UKIP | Godfrey Davey | 104 | 4.2 | ||
| Majority | 390 | 15.7 | |||
| Turnout | 42.8 | ||||
| Liberal Democrats gain from Conservative | Swing | ||||
| Party | Candidate | Votes | % | ±% | |
|---|---|---|---|---|---|
| Conservative | John Denbee | 1,285 | 58.0 | ||
| Liberal Democrats | Helen Groves | 932 | 42.0 | ||
| Majority | 353 | 15.9 | |||
| Turnout | |||||
| Conservative hold | Swing | ||||
2013–2017
| Party | Candidate | Votes | % | ±% | |
|---|---|---|---|---|---|
| Conservative | Linda Oliver | 1,163 | 47.7 | ||
| Liberal Democrats | Damon Hooton | 836 | 34.3 | ||
| Labour | Catherine Richardson | 163 | 6.7 | ||
| Independent | Adrian Dobinson | 139 | 5.7 | ||
| Green | Les Spalding | 139 | 5.7 | ||
| Majority | 327 | 13.4 | |||
| Turnout | |||||
| Conservative gain from Liberal Democrats | Swing | ||||
| Party | Candidate | Votes | % | ±% | |
|---|---|---|---|---|---|
| Conservative | Michael Adkins | 1,298 | 29.9 | ||
| Liberal Democrats | Barrie Hall | 976 | 22.5 | ||
| Labour | Libby Lisgo | 927 | 21.4 | ||
| UKIP | Robert Bainbridge | 814 | 18.8 | ||
| Green | Alan Debenham | 326 | 7.5 | ||
| Majority | 322 | 7.4 | |||
| Turnout | |||||
| Conservative gain from Liberal Democrats | Swing | ||||
See also
References
- ↑ "Somerset" . BBC News Online . 19 April 2009 . Retrieved 18 March 2010 .
- ↑ "Council minutes" . Somerset County Council . Retrieved 16 June 2022 .
- ↑ The County of Somerset (Electoral Arrangements) Order 1980
- ↑ "Somerset" . BBC Online . Retrieved 3 June 2008 .
- ↑ "New Faces Join Mendip District Council" . Mendip District Council. 30 May 2008 . Retrieved 18 March 2010 .
External links

|
