List of Oceanian countries by life expectancy
None
Data of the World Bank Group (2021)
List of countries by life expectancy at birth for 2021 according to the World Bank Group . [1] [2] [3] The data is filtered according to the list of countries in Oceania . The values in the World Bank Group tables are rounded. All calculations are based on raw data, so due to the nuances of rounding, in some places illusory inconsistencies of indicators arose, with a size of 0.01 year.
|
Countries &
territories |
2021 | Historical data | COVID-19 impact | |||||||||||||
|---|---|---|---|---|---|---|---|---|---|---|---|---|---|---|---|---|
| All | Male | Female |
Gender
gap |
2000 |
2000
→2014 |
2014 |
2014
→2019 |
2019 |
2019
→2020 |
2020 |
2020
→2021 |
2021 |
2019
→2021 |
2014
→2021 |
||
 Australia
|
83.30 | 81.30 | 85.40 | 4.10 | 79.23 | 3.07 | 82.30 | 0.60 | 82.90 | 0.30 | 83.20 | 0.10 | 83.30 | 0.40 | 1.00 |
|
 New Zealand
|
82.21 | 80.50 | 84.00 | 3.50 | 78.64 | 2.82 | 81.46 | 0.60 | 82.06 | 0.20 | 82.26 | −0.05 | 82.21 | 0.15 | 0.75 |
|
 French Polynesia
|
79.49 | 76.97 | 82.63 | 5.66 | 79.54 | 2.68 | 82.21 | 0.78 | 83.00 | −0.78 | 82.22 | −2.73 | 79.49 | −3.51 | −2.73 |
|
 New Caledonia
|
79.13 | 75.36 | 83.08 | 7.72 | 75.16 | 2.07 | 77.24 | 3.18 | 80.42 | 0.42 | 80.83 | −1.71 | 79.13 | −1.29 | 1.89 |
|
 Guam
Guam
|
76.66 | 72.98 | 80.70 | 7.72 | 74.42 | 2.33 | 76.75 | 0.97 | 77.72 | −1.11 | 76.61 | 0.04 | 76.66 | −1.06 | −0.09 |
|
 Samoa
Samoa
|
72.77 | 70.31 | 75.50 | 5.19 | 70.75 | 1.72 | 72.46 | −0.31 | 72.16 | 0.61 | 72.77 | −0.00 | 72.77 | 0.61 | 0.30 |
|
| World | 71.33 | 68.89 | 73.95 | 5.06 | 67.70 | 4.18 | 71.88 | 1.10 | 72.98 | −0.74 | 72.24 | −0.92 | 71.33 | −1.65 | −0.55 | |
 Tonga
Tonga
|
70.99 | 68.42 | 73.72 | 5.30 | 68.98 | 1.56 | 70.54 | 0.33 | 70.87 | 0.06 | 70.93 | 0.06 | 70.99 | 0.12 | 0.45 |
|
 Micronesia
|
70.71 | 67.12 | 74.61 | 7.49 | 69.77 | 1.76 | 71.53 | −0.45 | 71.08 | −0.40 | 70.67 | 0.04 | 70.71 | −0.37 | −0.82 |
|
 Vanuatu
|
70.45 | 68.40 | 72.94 | 4.55 | 68.97 | 0.50 | 69.47 | 0.41 | 69.88 | 0.42 | 70.30 | 0.15 | 70.45 | 0.57 | 0.98 |
|
 Solomon Islands
|
70.35 | 68.93 | 71.96 | 3.03 | 67.22 | 2.01 | 69.23 | 1.15 | 70.38 | −0.18 | 70.20 | 0.15 | 70.35 | −0.03 | 1.11 |
|
| Pacific island small states | 69.16 | 67.31 | 71.20 | 3.89 | 67.30 | 1.34 | 68.64 | 0.65 | 69.29 | 0.07 | 69.36 | −0.20 | 69.16 | −0.13 | 0.52 | |
 Kiribati
|
67.42 | 65.50 | 69.10 | 3.59 | 64.41 | 1.41 | 65.81 | 1.34 | 67.15 | 0.12 | 67.27 | 0.15 | 67.42 | 0.27 | 1.60 |
|
 Fiji
Fiji
|
67.11 | 65.43 | 68.88 | 3.45 | 66.31 | 1.07 | 67.38 | 0.52 | 67.89 | 0.03 | 67.92 | −0.81 | 67.11 | −0.78 | −0.26 |
|
 Papua New Guinea
|
65.35 | 62.95 | 68.42 | 5.47 | 61.72 | 2.54 | 64.26 | 1.22 | 65.47 | 0.31 | 65.79 | −0.44 | 65.35 | −0.12 | 1.09 |
|
 Marshall Islands
|
65.27 | 63.69 | 67.20 | 3.51 | 63.27 | 0.35 | 63.62 | 1.12 | 64.75 | 0.23 | 64.98 | 0.29 | 65.27 | 0.52 | 1.65 |
|
 Tuvalu
|
64.55 | 60.82 | 69.14 | 8.32 | 63.50 | 0.53 | 64.03 | 0.25 | 64.28 | 0.10 | 64.38 | 0.16 | 64.55 | 0.27 | 0.52 |
|
 Nauru
Nauru
|
63.62 | 60.26 | 67.30 | 7.04 | 58.73 | 3.08 | 61.81 | 1.68 | 63.48 | −0.05 | 63.44 | 0.18 | 63.62 | 0.13 | 1.81 |
|
Table "List by the United Nations (2020)" is removed since it is already outdated
United Nations (2021)
Estimation of life expectancy at birth by the analytical agency of the UN . [4] [5] [6] By default, the list is sorted by 2021.

|
Countries &
territories |
2019 | 2021 |
2019
→2021 |
||||||
|---|---|---|---|---|---|---|---|---|---|
| All | Male | Female |
Gender
gap |
All | Male | Female |
Gender
gap |
||
|
Australia
|
83.4 | 81.5 | 85.4 | 3.9 | 84.5 | 83.2 | 85.8 | 2.6 | 1.1 |
|
New Zealand
|
82.3 | 80.6 | 84.0 | 3.4 | 82.5 | 80.6 | 84.3 | 3.7 | 0.2 |
|
Samoa
|
73.3 | 71.3 | 75.5 | 4.2 | 72.8 | 70.3 | 75.5 | 5.2 | −0.5 |
| World | 72.8 | 70.6 | 75.0 | 4.4 | 71.4 | 68.9 | 74.0 | 5.1 | −1.4 |
|
Tonga
|
70.9 | 69.0 | 72.9 | 3.9 | 71.0 | 68.4 | 73.7 | 5.3 | 0.1 |
|
Micronesia
|
67.9 | 66.2 | 69.6 | 3.4 | 70.7 | 67.1 | 74.6 | 7.5 | 2.8 |
|
Vanuatu
|
70.5 | 69.0 | 72.2 | 3.2 | 70.4 | 68.4 | 72.9 | 4.5 | −0.1 |
|
Solomon Islands
|
73.0 | 71.3 | 74.9 | 3.6 | 70.3 | 68.9 | 72.0 | 3.1 | −2.7 |
|
Kiribati
|
68.4 | 64.2 | 72.3 | 8.1 | 67.4 | 65.5 | 69.1 | 3.6 | −1.0 |
|
Fiji
|
67.4 | 65.7 | 69.3 | 3.6 | 67.1 | 65.4 | 68.9 | 3.5 | −0.3 |
 Palau
Palau
|
73.9 | — | — | — | 66.0 | 62.4 | 70.6 | 8.2 | −7.9 |
|
Papua New Guinea
|
64.5 | 63.3 | 65.8 | 2.5 | 65.4 | 62.9 | 68.4 | 5.5 | 0.9 |
|
Marshall Islands
|
74.1 | — | — | — | 65.3 | 63.7 | 67.2 | 3.5 | −8.8 |
|
Tuvalu
|
— | — | — | — | 64.5 | 60.8 | 69.1 | 8.3 | |
|
Nauru
|
— | — | — | — | 63.6 | 60.3 | 67.3 | 7.0 |
Data of WHO (2019)
List of countries by life expectancy for 2019 according to the World Health Organization . [7] [8]
| Countries | Life expectancy at birth | HALE at birth | Life expectancy at age 60 | HALE at age 60 | |||||||||||||||||
|---|---|---|---|---|---|---|---|---|---|---|---|---|---|---|---|---|---|---|---|---|---|
| All | M | F | FΔM |
Δ
2000 |
All | M | F | FΔM |
Δ
2000 |
All | M | F | FΔM |
Δ
2000 |
All | M | F | FΔM |
Δ
2000 |
||
|
Australia
|
83.0 | 81.3 | 84.8 | 3.5 | 3.3 | 70.9 | 70.2 | 71.7 | 1.5 | 2.3 | 25.6 | 24.4 | 26.8 | 2.4 | 2.5 | 19.0 | 18.2 | 19.7 | 1.5 | 1.7 |
|
|
New Zealand
|
82.0 | 80.4 | 83.5 | 3.1 | 3.4 | 70.2 | 69.6 | 70.8 | 1.2 | 2.4 | 24.8 | 23.8 | 25.8 | 2.0 | 2.4 | 18.6 | 17.9 | 19.2 | 1.3 | 1.7 |
|
| World | 73.3 | 70.8 | 75.9 | 5.1 | 6.5 | 63.7 | 62.5 | 64.9 | 2.4 | 5.4 | 21.1 | 19.5 | 22.7 | 3.2 | 2.3 | 15.8 | 14.8 | 16.6 | 1.8 | 1.7 | |
|
Tonga
|
72.6 | 69.8 | 75.6 | 5.8 | 1.7 | 64.0 | 62.7 | 65.5 | 2.8 | 1.1 | 19.0 | 17.0 | 21.2 | 4.2 | 1.0 | 14.5 | 13.3 | 15.7 | 2.4 | 0.7 |
|
|
Samoa
|
70.5 | 69.2 | 71.8 | 2.6 | 2.0 | 62.1 | 61.8 | 62.5 | 0.7 | 1.4 | 17.9 | 17.4 | 18.3 | 0.9 | 0.8 | 13.4 | 13.3 | 13.5 | 0.2 | 0.5 |
|
|
Fiji
|
68.0 | 65.9 | 70.3 | 4.4 | 2.1 | 59.6 | 58.5 | 60.7 | 2.2 | 1.5 | 16.2 | 14.9 | 17.5 | 2.6 | 1.5 | 11.8 | 11.1 | 12.6 | 1.5 | 0.9 |
|
|
Vanuatu
|
65.3 | 62.7 | 68.3 | 5.6 | 1.4 | 57.8 | 56.4 | 59.4 | 3.0 | 1.0 | 15.7 | 14.8 | 16.7 | 1.9 | 0.7 | 11.9 | 11.5 | 12.4 | 0.9 | 0.4 |
|
|
Papua New Guinea
|
65.3 | 63.4 | 67.4 | 4.0 | 2.0 | 57.1 | 56.2 | 58.1 | 1.9 | 1.8 | 16.5 | 15.4 | 17.6 | 2.2 | 0.1 | 12.3 | 11.7 | 12.8 | 1.1 | 0.1 |
|
|
Solomon Islands
|
65.2 | 62.9 | 67.9 | 5.0 | 2.7 | 57.8 | 56.5 | 59.1 | 2.6 | 2.1 | 15.5 | 14.7 | 16.3 | 1.6 | 1.1 | 11.8 | 11.4 | 12.2 | 0.8 | 0.7 |
|
|
Micronesia
|
63.0 | 60.3 | 66.0 | 5.7 | 1.8 | 56.0 | 54.4 | 57.8 | 3.4 | 1.5 | 14.7 | 13.8 | 15.6 | 1.8 | 0.1 | 11.1 | 10.7 | 11.6 | 0.9 | −0.1 |
|
|
Kiribati
|
59.4 | 56.1 | 62.8 | 6.7 | 3.7 | 52.6 | 50.5 | 54.9 | 4.4 | 3.0 | 13.7 | 12.5 | 14.6 | 2.1 | 1.1 | 10.3 | 9.5 | 11.0 | 1.5 | 0.7 |
|
Charts
-
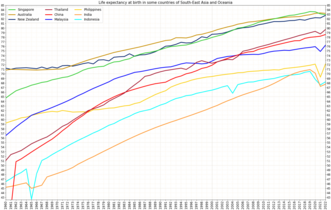 Life expectancy in some countries of South-East Asia and Oceania
 -
 Life expectancy and HALE in countries of Asia and Oceania in 2019
 -
 Elaboration by gender


See also
References
- ↑ "Life expectancy at birth, total" . The World Bank Group. 29 June 2023 . Retrieved 6 July 2023 .
- ↑ "Life expectancy at birth, male" . The World Bank Group. 29 June 2023 . Retrieved 6 July 2023 .
- ↑ "Life expectancy at birth, female" . The World Bank Group. 29 June 2023 . Retrieved 6 July 2023 .
- ↑ "Human Development Report 2020 (tables 1 and 4)" (PDF) . UN Development Programme . Archived from the original (PDF) on 15 December 2020 . Retrieved 28 February 2021 .
- ↑ "Human Development Report 2021/2022 (tables 1 and 4)" (PDF) . UN Development Programme . Retrieved 28 June 2023 .
- ↑ "Population & Demography Data Explorer" . Retrieved 3 July 2023 .
- ↑ "Life expectancy and Healthy life expectancy, data by country" . World Health Organization. 4 December 2022.
- ↑ "Life expectancy and Healthy life expectancy, data by WHO region" . World Health Organization. 7 December 2022.